You’ve seen the title, so you know this is leading to a certain fractal. Actually, it’s an infinite family of fractals. And yeah, it’ll be one of those mind-bogglingly intricate shapes that has infinite detail no matter how far you zoom in. But this is not really a video about generating some pretty picture for us to gawk at. Well, okay, maybe that’s part of it, but the real story here has a much more pragmatic starting point than the story behind a lot of other fractals.
And more than that, the final images that we get to will become a lot more meaningful if we make an effort to understand why, given what they represent, they kind of have to look as complicated as they do, and what this complexity reflects about an algorithm that is used all over the place in engineering.
The starting point here will be to assume that you have some kind of polynomial and that you want to know when it equals zero. So for the one graphed here you can visually see there are three different places where it crosses the x-axis, and you can kind of eyeball what those values might be. We’d call those the roots of the polynomial. But how do you actually compute them exactly?
Now, this is the kind of question where, if you’re already bought into math, maybe it’s interesting enough in its own right to move forward. But if you just pull someone on the street aside and ask them this, I mean they’re already falling asleep, because who cares? But the thing is this kind of question comes up all the time in engineering. Where I’m personally most familiar with equations like this popping up is in the setting of computer graphics, where polynomials are just littered all over the place.
So it’s not uncommon that when you’re figuring out how a given pixel should be colored that somehow involves solving an equation that uses these polynomials. Here let me give you one fun example. When a computer renders text on the screen, those fonts are typically not defined using pixel values. They’re defined as a bunch of polynomial curves, known in the business as “Bézier curves”, and any of you who’ve messed around with vector graphics, maybe in some design software, would be well familiar with these kinds of curves.
But to actually display one of them on the screen you need a way to tell each one of the pixels of your screen whether it should be colored in or not. These curves can be displayed either with some kind of stroke width or, if they enclose a region, some kind of fill for that region. But if you step back and you really think about it, it’s an interesting puzzle to figure out how each one of the pixels knows whether it should be colored in or not just based on the pure mathematical curve.
I mean, take the case of stroke width. This comes down to understanding how far away a given pixel is from this pure mathematical curve, which itself is some platonic ideal, it has zero width. You would think of it as a parametric curve that has some parameter t. Now one thing that you could do to figure out this distance is to compute the distance between your pixel and a bunch of sample points on that curve, then figure out the smallest. But that’s both inefficient and imprecise. Better is to get a little mathematical and acknowledge that this distance to the curve at all the possible points is itself some smooth function of the parameter, and as it happens the square of that distance will itself be a polynomial, which makes it pretty nice to deal with.
And if this were meant to be a full lesson on rendering vector graphics we could expand all that out and embrace the mess. But right now the only salient point that I want to highlight is that, in principle, this function whose minimum you want to know is some polynomial. Finding this minimum, and hence determining how close the pixel is to the curve and whether it should get filled in, is now just a classic calculus problem. What you do is figure out the slope of this function graph, which is to say its derivative, again some polynomial, and you ask when does that equal zero. So to actually carry out this seemingly simple task of just displaying a curve, wouldn’t it be nice if you had a systematic and general way to figure out when a given polynomial equals zero? Of course, we could draw a hundred other examples from a hundred other disciplines, I just want you to keep in mind that as we seek the roots of polynomials, even though we always display it in a way that’s cleanly abstracted away from the messiness of any real-world problem, the task is hardly just an academic one.
But again ask yourself, how do you actually compute one of those roots? If whatever problem you’re working on leads you to a quadratic function, then happy days, you can use the quadratic formula that we all know and love. And as a fun side note by the way, again relevant to root-finding in computer graphics, I once had a Pixar engineer give me the estimate that considering how many lights were used in some of the scenes for the movie Coco, and given the nature of some of these per-pixel calculations when polynomially defined things like spheres are involved, the quadratic formula was easily used multiple trillions of times in the production of that film.
When your problem leads you to a higher-order polynomial things start to get trickier. For cubic polynomials, there is also a formula, which Mathologer has done a wonderful video on. There’s even a quartic formula, something that solves degree-4 polynomials, although honestly that one is such a god-awful nightmare of a formula that essentially no one actually uses it in practice. But after that, and I find this one of the most fascinating results in all of math, you cannot have an analogous formula to solve polynomials that have a degree five or more. More specifically, for a pretty extensive set of standard functions, you can prove that there is no possible way that you can combine those functions together that allows you to plug in the coefficients of a quintic polynomial and always get out a root. This is known as the unsolvability of the quintic, which is a whole other can of worms we can hopefully get into it some other time, but in practice, it kind of doesn’t matter because we have algorithms to approximate solutions to these kinds of equations with whatever level of precision you want.
A common one, and the main topic for you and me today, is Newton’s method. And yes, this is what will lead us to the fractals, but I want you to pay attention to just how innocent and benign the whole procedure seems at first. The algorithm begins with a random guess let’s call it $x_0$. Almost certainly the output of your polynomial at $x_0$ is not zero, so you haven’t found a solution, it’s some other value visible as the height of this graph at that point. So to improve the guess, the idea is to ask when does a linear approximation to the function around that value equal zero? In other words if you were to draw a tangent line to the graph at this point, when does that tangent line cross the x-axis? Now assuming this tangent line is a decent approximation of the function in the loose vicinity of some true root, the place where this approximation equals zero should take you closer to that true root.
As long as you’re able to take a derivative of this function, and with polynomials you’ll always be able to do that, you can concretely compute the slope of this line. So here’s where the active viewers among you might want to pause and ask how do you figure out the difference between the current guess and the improved guess. What is the size of this step? One way to think of it is to consider the fact that the slope of this tangent line, its rise over run, looks like the height of this graph divided by the length of that step. And then you can just keep doing this until you’ve converged on a root.
On the other hand, the slope of the tangent line is the derivative of the polynomial at that point. By rearranging this equation, we can compute the step size to use for our next guess (which we might call x1). This guess is the previous guess adjusted by the step size. We can then repeat the process, computing the value of the function and the slope at the new guess, which gives us a new linear approximation. We can then make the next guess (x2) wherever the tangent line crosses the x-axis and apply the same calculation to x2 to get x3. Eventually, this will bring us close to the true root.
It’s important to check that a formula makes sense, and here, if p(x) is large (meaning the graph is high), we need to take a bigger step to get to a root. However, if P'(x) is large (meaning the graph is steep), we should take a smaller step. This method was originally developed by Newton, but Joseph Raphson published a simpler version of the algorithm. Nowadays, it is a common topic in calculus classes.
One interesting exercise is to use this method to approximate square roots by hand. But what calculus students don’t often consider is how deep this seemingly simple procedure can get when we start picking at its scabs. For example, if we start with a guess far from the root, the sequence of guesses can bounce around the local minimum of the function. It is only when the process throws the guess far enough to the left by chance that the sequence of guesses approaches the true root.
When we allow inputs to be complex numbers (which means the outputs could also be complex numbers), we can’t think about tangent lines and graphs anymore. But the formula still works, and we can start with a random guess and evaluate the polynomial and its derivative at that point, then use the update rule to generate a new guess. We can keep doing this until we’ve converged on a root. If I increase the number of steps, we can see that the regions around the roots become more and more defined.
Hopefully, that new guess is closer to the true root. But I want to make it clear that, even if we can’t visualize the steps with a tangent line, the logic is still the same. We’re figuring out where a linear approximation of the function around our guess would equal zero, and then we use that zero of the linear approximation as our next guess. It’s not like we’re blindly applying the rule to a new context with no reason to expect it to work. After a few iterations, we can see that we land on a value whose corresponding output is essentially zero.
Now, let’s apply this idea to many different possible initial guesses. For reference, I’ll put up the five true roots of this particular polynomial in the complex plane. With each iteration, each one of our little dots takes some step based on Newton’s method. Most of the dots will quickly converge to one of the five true roots, but there are some noticeable stragglers which seem to spend a while bouncing around. In particular, notice how the ones that are trapped on the positive real number line look a little bit lost.
This is exactly what we already saw before for the same polynomial when we were looking at the real number case with its graph. I’ll color each one of these dots based on which of those five roots it ended up closest to, and then we’ll roll back the clock so that every dot goes back to where it started.
At this level of detail, the color scheme is a little jarring to my eye at least, so I’ll calm it down a little. Really, whatever resolution I try to use to show this to you here could never possibly be enough, because the finer details of the shape we get will go on with endless complexity.
But take a moment to think about what this is actually saying. It means that there are regions in the complex plane where if you slightly adjust that seed value, you know you just kind of bump it to the side by 1 one-millionth or 1 one-trillionth, it can completely change which of the 5 true roots it ends up landing on. We saw some foreshadowing of this kind of chaos with the real graph and the problematic guess shown earlier, but picturing all of this in the complex plane really shines a light on just how unpredictable this kind of root-finding algorithm can be, and how there are whole swaths of initial values where the sort of unpredictability will take place.
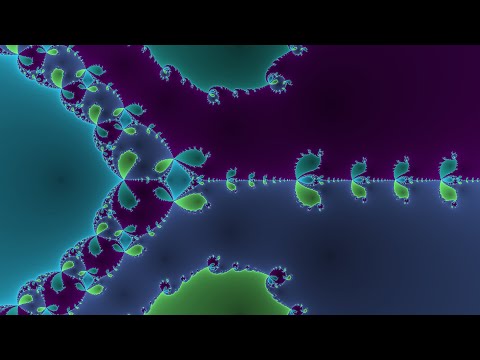
Now if I grab one of these roots and change it around, meaning that we’re using a different polynomial for the process, you can see how the resulting fractal pattern changes. Notice for example how the regions around a given root always have the same color since those are the points that are close enough to the root where this linear approximation scheme works as a way of finding that root with no problem. All of the chaos seems to be happening at the boundaries between the region, remember that. And it seems like no matter where I place these roots, those fractal boundaries are always there. It clearly wasn’t just some one-off for the polynomial we happen to start with, it seems to be a general fact for any given polynomial.
Another facet we can tweak here just to better illustrate what’s going on is how many steps of Newton’s method we’re using. If I increase the number of steps, we can see that the regions around the roots become more and more defined. It’s called the “open set condition”, and it’s a property that’s shared by all these kinds of diagrams.
If we let the computer take zero steps, meaning it just colors each point of the plane based on whatever root it’s already closest to, we would get a Voronoi diagram. If we let each point of the plane take a single step of Newton’s method, then color it based on what root that single step result is closest to, we would get a slightly more intricate pattern. If we allow for two steps, we get an even more intricate pattern, and so on and so on, where the more steps we allow the more intricate an image we get, bringing us closer to the original fractal.
We can ask questions like, maybe we want to try this out with some other polynomials to see how general it is, or maybe we want to dig deeper into what dynamics are exactly possible with these iterated points, or see if there’s connections with some other pieces of math that have a similar theme.
When using a cubic polynomial with three roots, we notice that some points are flying all over the place more chaotically. In fact, those ones are the most noticeable ones in an animation. On the other hand, when using a quadratic polynomial with two roots, each seed value does simply tend towards whichever root it’s closest to, the way that we might expect.
There is actually a reason that we can give for why this image has to look as complicated as it does - it’s called the “open set condition”. It’s a property that’s shared by all these kinds of diagrams. Focus your attention on just one of the colored regions, say the blue one. In other words, the set of all points that eventually tend towards just one particular root of the polynomial. Now consider the boundary of that region, which for the example shown on screen has this kind of nice three-fold symmetry. What’s surprising is that if you look at any other color and consider its boundary, you get precisely the same set.
Now when I say the word “boundary”, you probably have an intuitive sense of what it means, but mathematicians have a pretty clever way to formalize it, and this makes it easier to reason about in the context of more wild sets like our fractal. We say that a point is on the boundary of a set if, when you draw a small circle centered at that point, no matter how small, it will always contain points that are both inside that set and outside. So if you have a point that’s on the interior, a small enough circle would eventually only contain points inside the set. And for a point on the exterior, a small enough circle contains no points of the set at all. But when it’s on the boundary, what it means to be on the boundary, is that your tiny tiny circles will always contain both.
So looking back at our property, one way to read it is to say that if you draw a circle, no matter how small that circle is, it either contains all of the colors, which happens when this shared boundary of the colors is inside that circle, or it contains just one color, and this happens when it’s in the interior of one of the regions. In particular, what this implies is you should never be able to find a circle that contains just two of the colors since that would require that you have points on the boundary between two regions but not all of them.
And before explaining where this fact actually comes from, it’s fun to try just wrapping your mind around it a little bit. You could imagine presenting this to someone as a kind of art puzzle, completely out of context, never mentioning Newton’s method or anything like that. You say that the challenge is to construct a picture with at least three colors, maybe we say red, green, and blue, so that the boundary of one color is the boundary of all of them.
So if you started with something simple like this, that clearly doesn’t work because we have this whole line of points that are on the boundary of green and red but not touching any blue. And likewise you have these other lines of disallowed points. So to correct that you might go and add some blue blobs along the boundary and then likewise add some green blobs between the red and blue and some red blobs between the green and blue. But of course, now the boundary of those blobs are a problem, for example, touching just blue and red but no green. So maybe you go and you try to add even smaller blobs with the relevant third color around those smaller boundaries to help try to correct. And likewise you have to do this for every one of the blobs that you initially added. But then all the boundaries of those tiny blobs are problems of their own and you would have to somehow keep doing this process forever.
If you look at Newton’s fractal itself this sort of blobs on blobs on blob’s pattern seems to be exactly what it’s doing. The main thing I want you to notice is how this property implies you could never have a boundary which is smooth or even partially smooth on some small segment, since any smooth segment would only be touching two colors. Instead the boundary has to consist entirely of sharp corners, so to speak. So if you believe the property it explains why the boundary remains rough no matter how far you zoom in, and for those of you who are familiar with the concept of fractal dimension you can measure the dimension of the particular boundary I’m showing you right now to be around 1.44. Considering what our colors actually represent – remember this isn’t just a picture for pictures sake – think about what the property is really telling us. It says that if you’re near a sensitive point where some of the seed values go to one root but other seed values nearby would go to another root, then in fact every possible route has to be accessible from within that small neighborhood. For any tiny little circle that you draw either all of the points in that circle tend to just one root or they tend to all of the roots but there’s never going to be anything in between, just tending to a subset of the roots. For a little intuition, I found it enlightening to simply watch a cluster like the one on screen undergo this process. It starts off mostly sticking together but at one iteration they all kind of explode outward and after that it feels a lot more reasonable that any root is up for grabs. And keep in mind, I’m just showing you finitely many points but in principle you would want to think about what happens to all uncountably infinitely many points inside some small disk.
This property also kind of explains why it’s okay for things to look normal in the case of quadratic polynomials with just two roots, because there a smooth boundary is fine – there are only two colors to touch anyway. To be clear, it doesn’t guarantee that the quadratic case would have a smooth boundary, it is perfectly possible to have a fractal boundary between two colors, it just looks like our Newton’s method diagram is not doing anything more complicated than it needs to under the constraint of this strange boundary condition.
But of course all of this simply raises the question of why this bizarre boundary property would have to be true in the first place, where does it even come from? For that, I’d like to tell you about a field of math which studies this kind of question, it’s called holomorphic dynamics. And I think we’ve covered enough ground today, and there’s certainly enough left to tell, so it makes sense to pull that out as a separate video.
To close things off here, there is something sort of funny to me about the fact that we call this Newton’s fractal despite the fact that Newton had no clue about any of this, and could never have possibly played with these images the way that you and I can with modern technology. It happens a lot through math that people’s names get attached to things well beyond what they could have dreamed of. Hamiltonians are central to quantum mechanics despite Hamilton knowing nothing about quantum mechanics. Fourier himself never once computed a Fast Fourier Transform. The list goes on. But this over-extension of nomenclature carries with it what I think is an inspiring point. It reflects how even the simple ideas, ones that could be discovered centuries ago, often hold within them some new angle or a new domain of relevance they can sit waiting to be discovered hundreds of years later. It’s not just that Newton had no idea about Newton’s fractal. There are probably many other facts about newton’s method, or about all sorts of math that may seem like old news, that come from questions that no one has thought to ask yet. Questions that are just sitting there waiting for someone like you to ask them. For example, if you were to ask about whether this process we’ve been talking about today ever gets trapped in a cycle, it leads you to a surprising connection with the Mandelbrot set, and we’ll talk a bit about that in the next part. At the time that I’m posting this, that second part, by the way, is available as an early release to patrons. I always like to give new content a little bit of time there to gather feedback and catch errors. The finalized version should be out shortly.
And on the topic of patrons, I do just want to say a quick thanks to everyone whose name is on the screen. Recently, the release of new videos has been a bit slow. This is due to other projects that have been in the works, such as the Summer of Math Exposition, which was quite a bit of work, but the outcome was worth it. I will be announcing the winners soon, so stay tuned.
Going forward, the plan is to focus more on creating new videos. I want to thank everyone for their continued support, even during times of trying something new. It means a lot to me, and it’s what keeps the channel going. I will do my best to make sure the new lessons live up to your expectations.